RTX 4060 Ti 16 GB vs RTX 4070 Ti Super for local AI in 2026
16 GB nominal memory; check the model and context budget.
- VRAM
- 16 GB
- Bandwidth
- 288 GB/s
- TDP
- 165 W
- Price
- $450-550 (2026 retail)
16 GB Ada midrange; balanced consumer pick.
- VRAM
- 16 GB
- Bandwidth
- 672 GB/s
- TDP
- 285 W
- Price
- $800-1,000 (2026 retail)
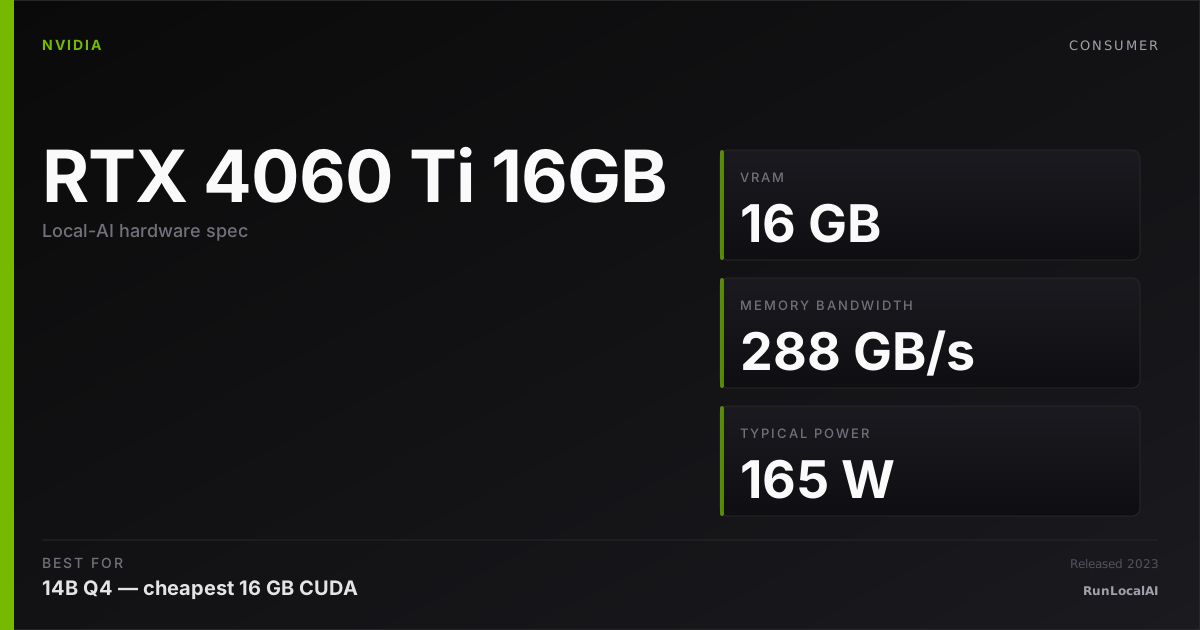
RTX 4060 Ti 16 GB
16 GB nominal memory; check the model and context budget.
RTX 4070 Ti Super
16 GB Ada midrange; balanced consumer pick.
Memory planning: RTX 4060 Ti 16 GB — 16 GB nominal memory: check 13–14B Q4. Reserve space for KV cache and runtime; offload is a separate configuration. RTX 4070 Ti Super — 16 GB nominal memory: check 13–14B Q4. Reserve space for KV cache and runtime; offload is a separate configuration.
Who wins each workload
Each row is a workload local-AI operators actually run. Verdicts derived from VRAM math + bandwidth — no editorial hand-wave.
What each card actually runs
VRAM math against a canonical set of popular models. The largest context window that fits with headroom appears in each cell.
| Model | RTX 4060 Ti 16 GB | RTX 4070 Ti Super |
|---|---|---|
Qwen 3 14B Q4_K_M 14B params · Q4_K_M | 16K ctx, tight | 16K ctx, tight |
Qwen 3 32B Q4_K_M 32B params · Q4_K_M | OOM | OOM |
Llama 3.3 70B Q4_K_M 70B params · Q4_K_M | OOM | OOM |
DeepSeek R1 distill 32B 32B params · Q4_K_M | OOM | OOM |
Mixtral 8x22B Q4 141B params · Q4_K_M | OOM | OOM |
FLUX.1 image gen 12B params · FP16 | OOM | OOM |
Fit figures are estimates. We have removed throughput and cost rankings without matched measurements. Compare model, quantization, context and runtime in the benchmark records. Price ranges are editorial estimates, not live merchant quotes.
Quick decision rules
Operational matrix
| Dimension | RTX 4060 Ti 16 GB 16 GB nominal memory; check the model and context budget. | RTX 4070 Ti Super 16 GB Ada midrange; balanced consumer pick. |
|---|---|---|
VRAM Both 16 GB. | Strong 16 GB GDDR6. | Strong 16 GB GDDR6X. |
Memory bandwidth Decode speed driver. | — 16 GB nominal memory: check 13–14B Q4. Reserve space for KV cache and runtime; offload is a separate configuration. | Strong 672 GB/s. ~2.3x the 4060 Ti. |
Compute (FP16) Prefill + matmul. | Acceptable ~22 TFLOPS FP16. | Strong ~44 TFLOPS FP16. ~2x the 4060 Ti. |
Power TDP. | Excellent 165W. 550W PSU sufficient. | Acceptable 285W. 750W PSU recommended. |
Price (2026) Retail. | Excellent $450-550. Cheapest 16 GB NVIDIA option. | Acceptable $800-1,000. ~2x the 4060 Ti. |
Realistic 70B Q4 tok/s Approximate decode speed. | — 16 GB nominal memory: check 13–14B Q4. Reserve space for KV cache and runtime; offload is a separate configuration. | — 16 GB nominal memory: check 13–14B Q4. Reserve space for KV cache and runtime; offload is a separate configuration. |
Tiers are qualitative editorial labels, not derived from a single benchmark. For tok/s and VRAM measurements on these cards, browse the corpus or request a benchmark.
Who should AVOID each option
Avoid the RTX 4060 Ti 16 GB
- If you're chasing maximum single-card tok/s
Avoid the RTX 4070 Ti Super
- If 13B-32B is your target — bandwidth advantage doesn't help much
- If price-per-card matters more than per-card speed
Workload fit
RTX 4060 Ti 16 GB fits
- Budget multi-card rig
- Learning local AI
RTX 4070 Ti Super fits
- Single-user balance
- Mid-tier consumer
Where to buy
Affiliate links — no extra cost. Prices are editorial ranges, not real-time. Click through to verify.
Some links above are affiliate links. We may earn a commission at no extra cost to you. How we make money.
Editorial verdict
HonestyWhy benchmark numbers on this page might not reflect your real experience
- tok/s is not user experience. Humans read at ~10-15 tok/s — anything above that is buffer time, not perceived speed.
- Context length changes everything. A 70B Q4 model at 1024 tokens generates ~25 tok/s; the same model at 32K context drops to ~8-12 tok/s as KV cache fills.
- Quantization changes the conclusion. Q4_K_M vs Q5_K_M vs Q8 produce different speed AND different quality. A benchmark at one quant doesn't translate to another.
- Thermal throttling changes long sessions. The first 15 minutes of a benchmark see boost-clock peak; the next 4 hours see steady-state, which is 5-15% slower depending on case airflow.
- Driver and runtime versions silently shift winners. A 2024 benchmark on PyTorch 2.4 + CUDA 12.4 doesn't reflect 2026 reality on PyTorch 2.6 + CUDA 12.6. Discount benchmarks older than 6 months.
- Vendor and YouTuber benchmarks are cherry-picked. The standard 'Llama 3.1 70B Q4 at 1024 tokens' chart shows peak decode on a tiny prompt — exactly the conditions least representative of daily use.
- A 25-30% throughput gap between two cards rarely translates to a 25-30% experience gap. Both cards are fast enough; the differentiator is usually VRAM ceiling, not raw decode speed.
We try to surface these caveats where they apply. If a number on this page reads more confident than it should, please email us via contact. See also our methodology and editorial philosophy.
Don't see your specific workload?
The matrix above is editorial. If you want a measured tok/s number for a specific model + quant on either card, file a benchmark request — the community claims requests and reproduces them under our methodology checklist.